

Cities are drowning in data—data from road sensors, fare collection systems, cameras, and buses to name just a few.
What’s more, cities are making much of that data available through open data hubs to support open government initiatives but transforming that data from disparate information points and formats into a unified source of truth remains elusive for many cities.
To demonstrate the power of bringing open data sets into a uniform picture, Cubic collected open data feeds from the city of Barcelona in our Data Management and Analytics Platform (DMAP) to capture a full view of mobility across the city.
With data feeds, real-time and historical data are combined to allow cities to make stronger decisions for policy, operations, and integrated transport network management.
Policy: Understanding Transit Equity through Data
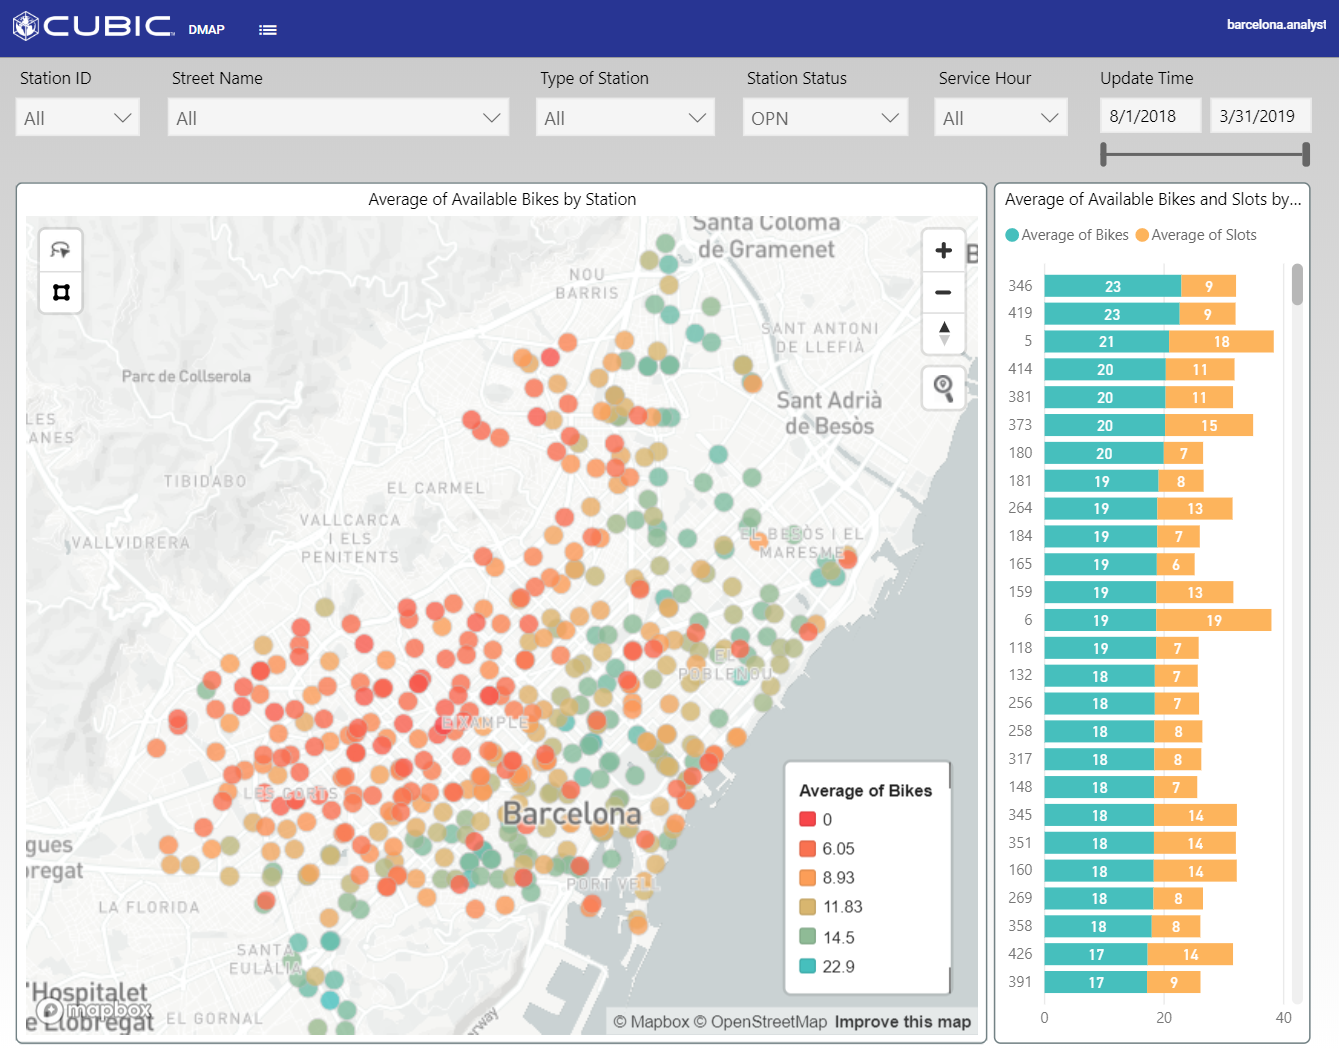
Barcelona publishes bike share usage data, providing a clear case to city planners that many commuters rely on bikeshare to get to work in the morning and home in the evening.
Reviewing the daily bike availability data demonstrates that before the morning commute, bikes are congregated in more residential neighborhoods, and move to business centers once work hours commence.
This analysis makes a case for expanding bike availability to ensure that micromobility programs can meet the demand at the locations and times that users want to travel.
Bike share has environmental and health benefits for a city, but besides promoting these policy outcomes, combining bike share, transit network and socioeconomic data provides a tool for ensuring that all neighborhoods benefit from these types of programs.
Analyzing bike availability in transit poor neighborhoods presents the opportunity to strategically expand micromobility options in areas where users have more limited access to transit, promoting economic opportunity and connectivity in addition to health and environmental policies.
Operations: Turning Hidden Data into Assets
A host of agencies use Twitter as a tool to inform the public about disruptions happening in the network. In turn, users can retweet, tweet at, and tag cities and transportation agencies in response to arising or ongoing challenges that they notice.
For agencies, social media may seem like another way to keep patrons happy, but there is a host of data that their users are generating about operations of the network, if only agencies had a way to systematically access and analyze it.
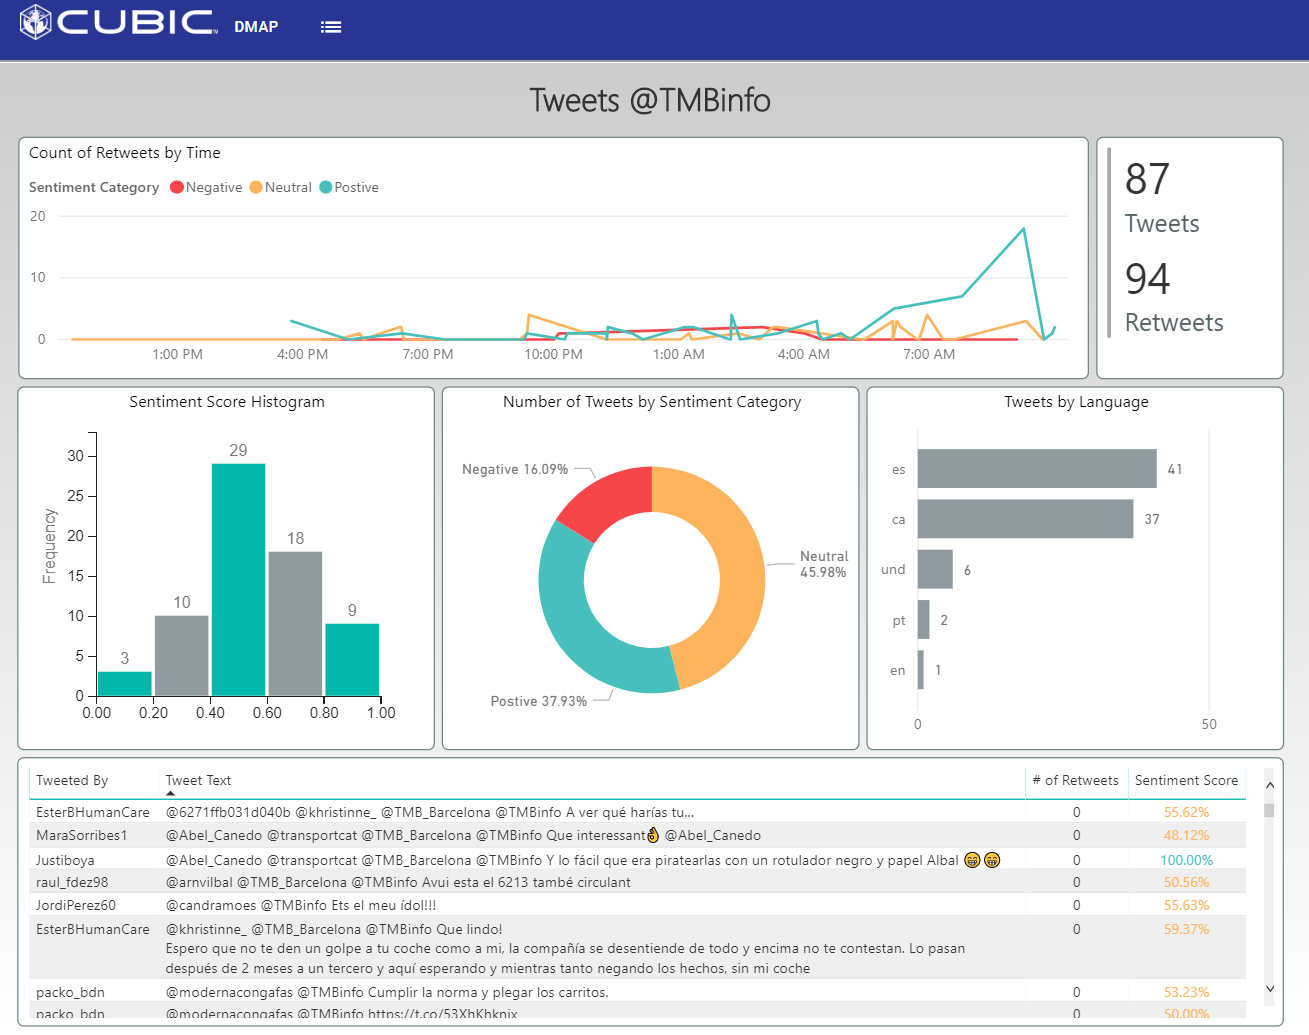
Cubic applied sentiment analysis machine learning techniques to tweets from the Barcelona Metro (@TMBInfo) to harness Twitter as a tool for operational monitoring.
Through systematically collecting and categorizing tweets according to sentiment, agencies can identify challenges in real-time and determine if there are disruptions happening in the network, before they have the chance to derail passengers.
In the case of Barcelona, there were users tweeting about delays on a specific metro line, which a transit operations manager could then investigate.
By applying sentiment analysis, transportation operators can turn textual data into avaluable real-time assets, while limiting time devoted to culling through tweets to uncover valuable timely information.
Integrated Networking Management: Combining Traffic and Transportation
Barcelona makes its bus arrivals data available, in addition to traffic data throughout the city.
Through reformatting, quality checking and then overlaying these two different data sets, transportation operators can analyze where long wait times and delays on buses are the result of congestion.
Armed with this knowledge, planners can adjust asset allocation, routes and schedules to accommodate typical congestion, and operators can identify periods when particularly heavy traffic is likely to impact passenger journeys and warn users accordingly.
Bringing in camera feeds, transit managers and road managers could identify hot spots where traffic speeds are slowing, and consult cameras and social media sentiment analysis for a live view of what’s going on.
On their own, bus arrivals time, traffic, camera, micromobility and social media feeds may support siloed analyses for specific transit and transportation operations, but unifying the views allows a city to pull together a holistic picture of the interdependencies across the network, and prioritize solutions armed with data.
Barcelona is just one example of the wealth of data that is made available by cities every day – the missing piece, and where Cubic’s DMAP product and Analytics Service SMEs come in, is inventorying, integrating and analyzing that data to provide the power to monitor, crisis manage and more broadly plan for the future.